Android Vitals: Thresholds That Cost Installs
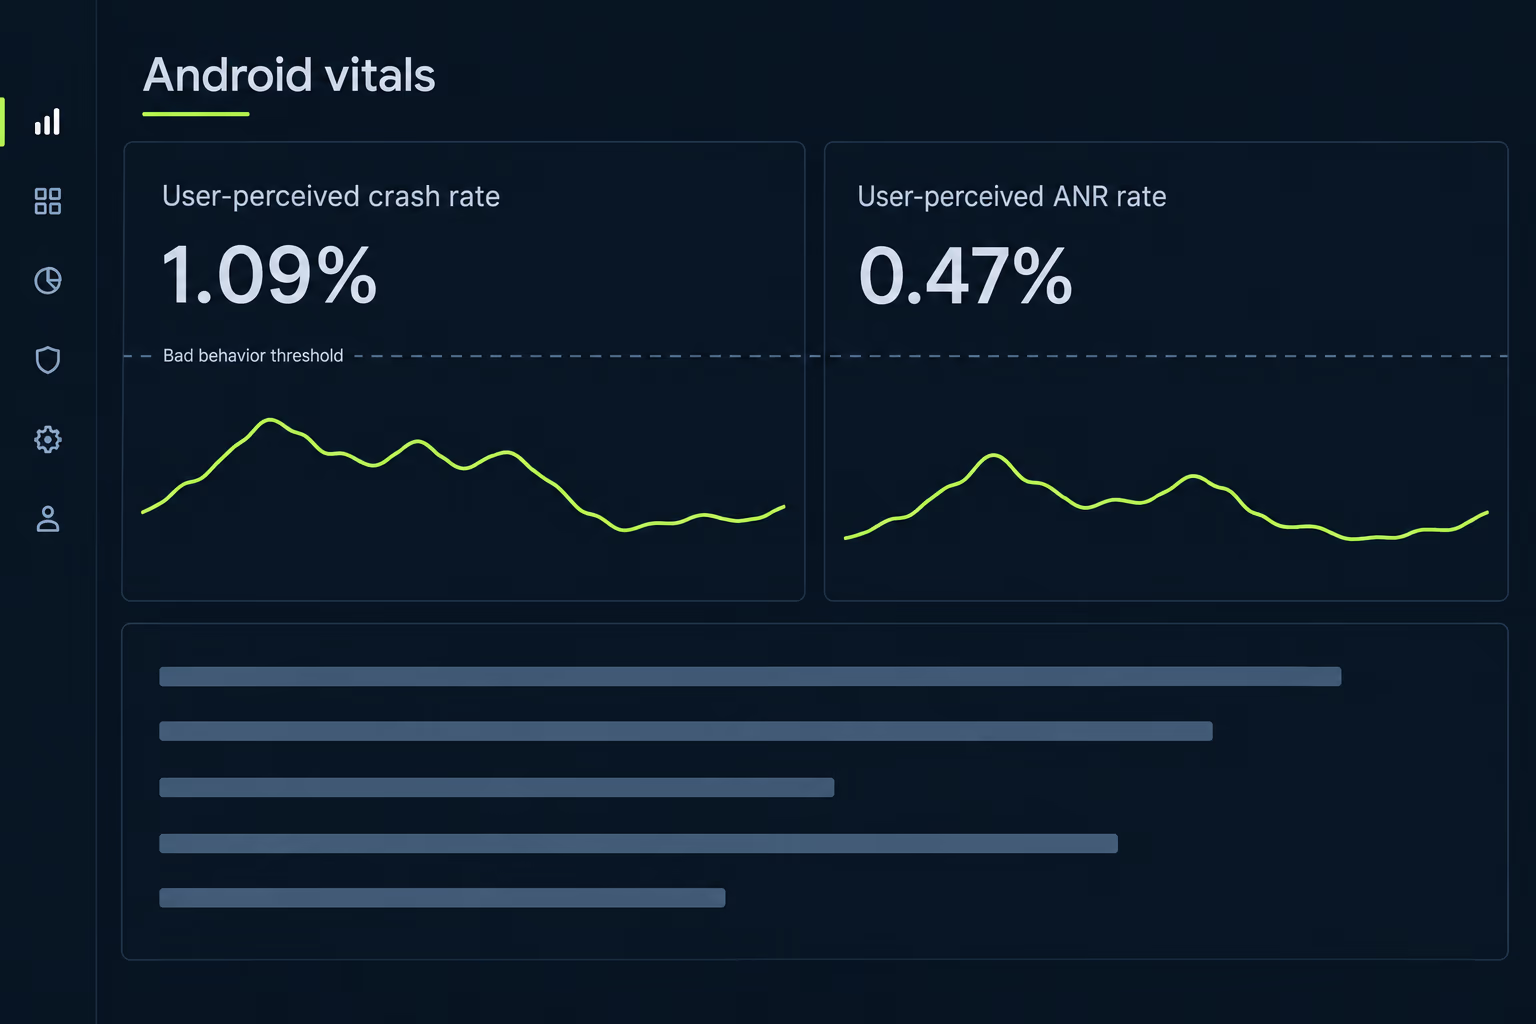
Android vitals is the Play Console’s own measurement of how your app behaves on real phones, and two of its numbers decide whether Google Play keeps putting your app in front of new users. Your app crosses what Google calls the bad behavior threshold when a visible crash reaches at least 1.09% of daily active users, or a freeze counted as an ANR reaches at least 0.47% of daily users. Cross either line and Play may reduce your app’s visibility and show a warning on your store listing. What follows is the current threshold set with the penalty attached to each one, and the order to work through them in.
Search for any of this and you land on Google’s reference documentation, a 2017 announcement post and a forum thread full of people who got the warning email and don’t know what it means. None of that is written for somebody who owns an app and has to decide what it’s worth spending to clear the warning. Every threshold and time window below was checked against Google’s own documentation while this was written.
What is Android vitals, and which numbers actually matter?
Android vitals is a set of measurements Google collects automatically from devices running your app, and only a small group of them carries a penalty. You don’t add a library or write any code to switch it on, and the numbers appear in the Play Console under the quality section whether or not anybody on your side is looking at them.
The measurements split into two groups that get treated very differently. The core vitals are the ones Google acts on, covering the user-perceived crash rate, the user-perceived ANR rate, excessive partial wake locks, two memory measurements, and excessive battery usage for watch face apps. Everything else, including startup time, rendering speed, permission denials and low memory kill rates, sits in a second group that Google publishes for your benefit but doesn’t penalise you for.
That prefix on the two headline metrics does a lot of work. User-perceived means the measurement counts only the crashes and freezes that happened while somebody was actually using the app and would have noticed something go wrong. Sitting right beside them in the Console are plain crash rate and ANR rate figures that include background events too, so those numbers run higher and regularly send teams into a panic over the wrong statistic. When you’re checking your standing against a threshold, the user-perceived version is the one Google is judging you on.
One definition underneath all of this changes how you read a sudden movement in the graph. Google counts a user session as the sum of a person’s activity across a 24 hour period starting at midnight Pacific Time, regardless of where your users live, and a day with no activity records no session rather than a clean one. The Play Console keeps 90 days of this history, while the Play Developer Reporting API hands you three years.
What are the bad behavior thresholds right now?
Google publishes a specific number for every vital it penalises, and the overall limits are considerably tighter than most teams assume. Here’s the current set, with the overall figure measured across your whole user base and the per model figure measured on each individual phone separately.
| Vital | Overall threshold | Per device model |
|---|---|---|
| User-perceived crash rate | 1.09% of daily active users | 8% of daily active users (4% per watch model) |
| User-perceived ANR rate | 0.47% of daily users | 8% of daily users (5% per watch model) |
| Excessive partial wake locks | 5% of battery sessions | not applied per model |
| Excessive battery usage (watch faces) | 1% of watch face sessions | 1% of watch face sessions |
| DEX code optimization | 25% minimum | not applied per model |
The two stability numbers matter to almost every app, and the distance between them surprises people. You’re allowed more than twice as many visible crashes as visible freezes before Google intervenes, which tells you how badly Play rates the experience of an app that simply stops responding to you.
The remaining vitals apply to narrower situations. Excessive partial wake locks counts sessions where your app held the processor awake for more than an hour with the screen off and the device unplugged, which is the classic battery drain complaint behind a one star review. The watch face figure only concerns Wear OS apps, and DEX code optimization works in the opposite direction from the others, since it’s a minimum you need to reach rather than a ceiling to stay under.
Outside the penalised set, several diagnostic numbers still tell you where the damage is coming from. Google flags excessive slow frames when more than half of an app’s frames miss the drawing deadline of roughly 16 milliseconds, and excessive frozen frames when more than 0.1% of frames take longer than 700 milliseconds to render. Excessive wake-ups means more than 10 an hour on battery, and excessive background Wi-Fi scans means more than four an hour while unplugged. None of those four earns you a warning by itself, and any of them can be the reason your crash or battery numbers look the way they do.
What happens to your app when it crosses a threshold?
Two things happen, and the second does most of the commercial damage. Google’s wording is that Play may reduce the visibility of your title, and may also show users a warning on your store listing. The visibility reduction takes you out of some recommendation surfaces, which is invisible to you except as a quiet decline in installs.
The store listing warning is the expensive one, because of where it appears. Google began showing it on 30 November 2022, and it tells a prospective user that the app may not work properly on their device based on recent data from similar devices. Somebody reads that sentence at the exact moment they were deciding whether to install, after your screenshots and your description have already done their job. Every dollar you spend driving people to that listing now funds a page that talks them out of installing.
What makes this harder to catch early is that nothing in your own analytics shows it. Your crash reporting tool reports crashes and your attribution tool reports installs, and neither reports that Google has put a notice on your listing. The only reliable signals are the vitals page itself and the email Google sends when your app first crosses a line, which is the email a lot of owners forward to a developer, get a reassuring reply about, and never follow up on.
Why can a single phone model trigger a warning on its own?
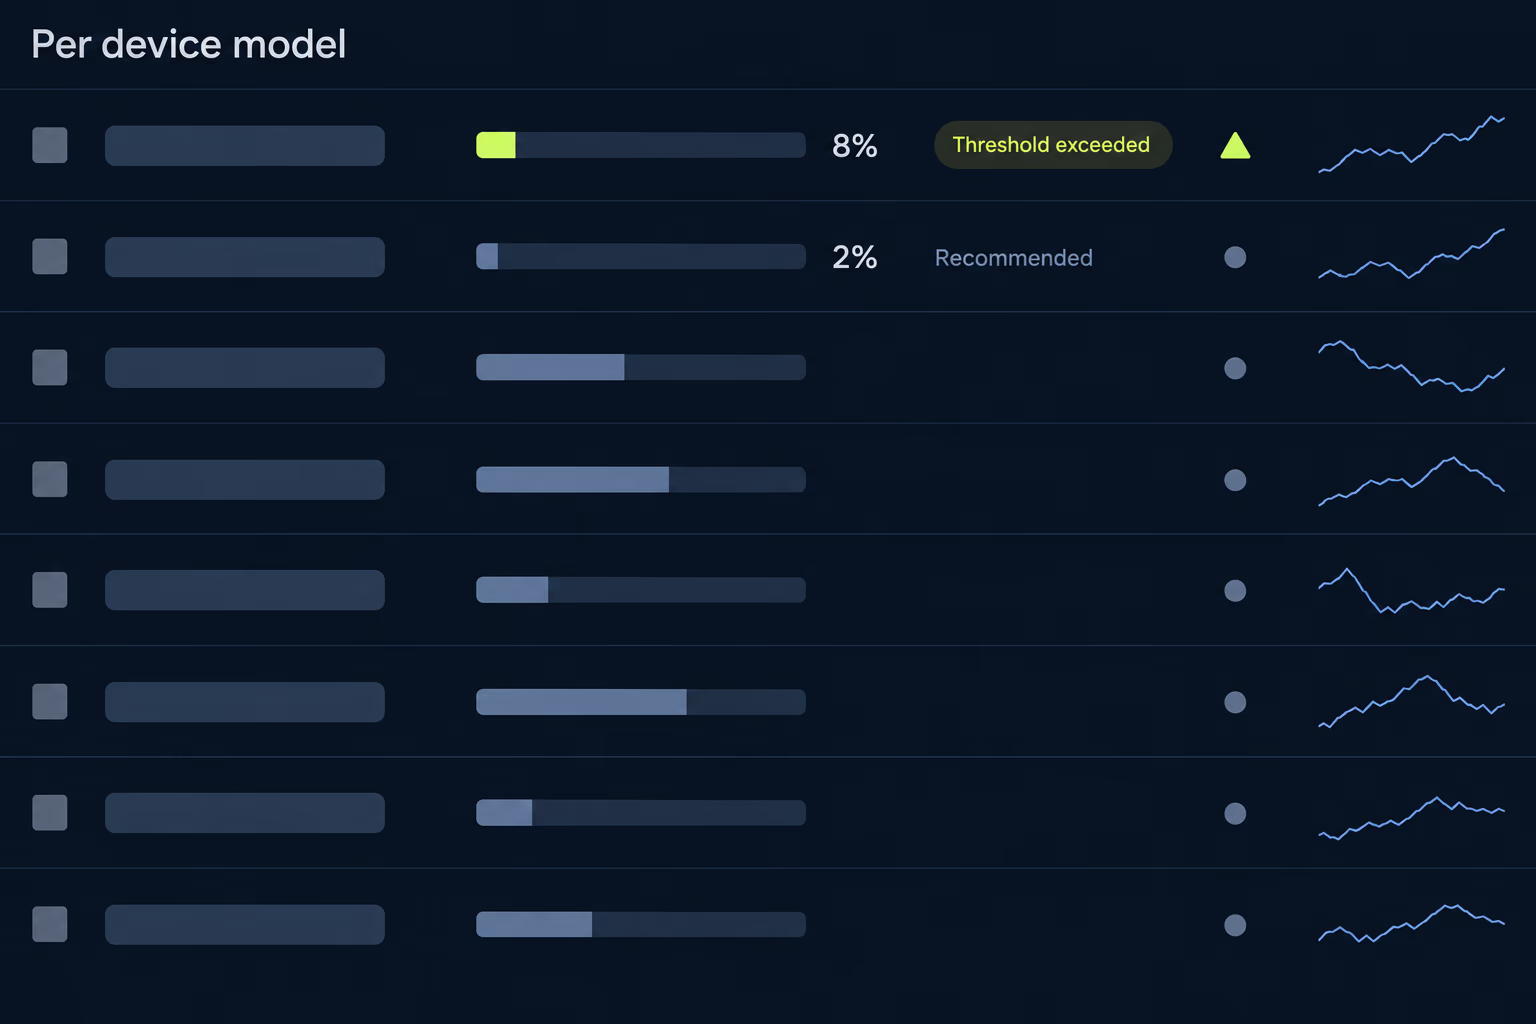
Because Google measures every phone model separately as well as measuring your whole user base together, and an app can fail either test independently. The per model limit of 8% is far looser than the 1.09% overall figure, which sounds generous until you remember that one model is enough to produce a warning for everybody using it. Google’s documentation confirms that having both an overall and a per device bad behavior at once is entirely possible.
The causes tend to be specific rather than general. A particular manufacturer’s Android build, an unusual screen geometry, a graphics driver that handles something differently, or a device with much less memory than your testing fleet will all produce failures that never appear on the phones your team actually owns. Google helps here by flagging possible links between high error rates and factors like RAM, Android version and processor type, and the Reach and Devices section of the Console lets you dig into the same question yourself. Because Google steers users on the affected devices away from your listing and leaves everybody else alone, the install decline arrives in an odd shape, hitting one segment hard while the overall chart barely moves.
Google’s advice on the target is stricter than its own threshold. The guidance is to aim for per phone stability no worse than 2%, which leaves real headroom rather than treating 8% as a pass mark. Treating the threshold as the goal means living permanently one bad release away from a warning.
When a device genuinely can’t be fixed at a sensible cost, Google’s own answer is to reconsider your device targeting and exclusion rules, which stops the app being offered on hardware it can’t run properly. You lose those installs either way, and excluding the device at least keeps the failures out of your aggregate numbers.
Which vital should you fix first when the budget is limited?
Start with whichever of the two stability numbers is over its line, and if both are over, start with ANR. The reasoning is proportional rather than technical, since the ANR threshold sits at roughly a fifth of the crash threshold, so being over on ANR usually means you’re further past the line in relative terms and closer to a listing warning.
Within either metric, the Console groups events into clusters and ranks them by how many users they affect, and that ranking is almost always the right order to work in. A single cluster commonly accounts for a large share of a bad crash rate, which means one genuine fix can move a number that looked hopeless. Chasing the long tail of rare crashes first is how teams spend a month and move the average by nothing at all. The mobile app stabilization work we do at RapidLabs starts by ranking clusters this way for exactly that reason.
Freezes deserve a separate note because they’re diagnosed differently from crashes. An ANR is recorded when your app stops responding to input for too long, and the stack you get back shows you where the main thread was stuck rather than where something threw an exception. That makes them harder to read and much harder to reproduce on a developer’s machine, and we covered the diagnosis process in detail in our guide to the Android ANR rate.
Battery problems come third for most apps, with one exception. If your reviews mention battery drain by name, move wake locks up the list regardless of where the number sits, because a review saying an app destroys the battery does damage no threshold measures. Read the rendering and startup numbers as evidence rather than as targets, since a screen that renders badly is frequently the same screen producing the freezes.
How do you work on this when you inherited the app?
Get access to the Play Console account first, before anybody looks at the code. Android vitals exists only inside the account that publishes the app, so a previous developer who still holds that account leaves you guessing at numbers Google has already measured and is already acting on. This is the most common blocker we see on a handover, and it’s administrative rather than technical.
Once you can see the data, the second problem is that vitals alone won’t tell you enough to fix anything. The Console gives you aggregated rates and clustered stack traces, and on an unfamiliar codebase those traces often point at framework code rather than anything you recognise. You need a crash reporting tool you control, with your own symbol files uploaded, so a trace maps back to a line in a file you can open. Our comparison of Crashlytics and Sentry covers the choice, and either beats working from Play Console clusters alone.
The three year history available through the Play Developer Reporting API is worth pulling early on a neglected app. Ninety days of Console history frequently isn’t long enough to answer whether a crash rate has been drifting upward for years or jumped on a specific release date, and those two situations call for completely different work. A jump gives you a version number to examine, while a drift usually means the app is falling behind the devices its users have moved to.
Expect the device breakdown to be the most useful screen on the page during a takeover. An app built and tested against a narrow set of phones years ago tends to fail in a concentrated way on hardware that arrived afterwards, and that concentration tells you whether you’re facing a general quality problem or a compatibility one. The app takeover work RapidLabs does opens with this exact read, because it decides whether the first sprint goes into fixing code or into device coverage.
How long before the warning goes away after you ship a fix?
Google checks your app’s performance indicators daily and works from a 28 day average, so the warnings disappear once that average has improved rather than on the day your fix goes live. Store listing warnings can lift sooner than the full 28 days when Play’s systems detect the improvement early, though the underlying vitals warnings follow the rolling average.
Your own rollout is usually the slower half of that clock. The average can only improve as quickly as people install the fixed version, so an app with poor update adoption stays under a warning for weeks after the work is finished. Staged rollouts stretch it further, which is a reasonable trade when you’re being careful and a painful one when you’re trying to clear a warning that’s costing installs every day.
Set expectations accordingly with whoever is paying for the work, because a fix that lands on Monday doesn’t produce a clean number by Friday. You’ll see the daily rate improve within days among users on the new version, while the 28 day average Google judges you on takes several weeks to catch up.
Getting your vitals back under the line
Android vitals is worth taking seriously for a better reason than the grading. The two numbers carrying a penalty measure the experiences your users would describe as the app being broken, and Google reacts to them earlier and more decisively than your review score does. An app sitting at 1.5% user-perceived crashes was losing customers long before the threshold email arrived.
Work through it in the order the numbers give you. Confirm which metric is over its line and whether the problem is spread across your user base or concentrated on particular hardware, fix the largest cluster rather than the most interesting one, and hold the per model figure to Google’s suggested 2% rather than the 8% that triggers a warning. Then wait out the 28 day average without touching anything else, so you can tell what the fix actually did.
If the app came to you with the vitals already red and no history you can read, that read is a job in itself before any code changes. You’re welcome to talk to a senior engineer about your app if you’d rather go through the Console data with somebody first.
Frequently asked questions
What is the Android vitals bad behavior threshold?
It's the point at which Google Play stops treating a quality problem as your business and starts acting on it. Across all devices, an app crosses it when a visible crash reaches at least 1.09% of daily active users, or a freeze counted as an ANR reaches at least 0.47% of daily users. There's a second, separate threshold measured on each individual phone model, set at 8% for both crashes and ANRs. Exceeding either version of the limit can reduce how often Play shows your app and can put a warning on your store listing.
Why does my app exceed the Android vitals threshold on only one device?
Because Google measures every phone model separately as well as measuring your whole user base together, and the per model limit of 8% is far looser than the overall one. A driver bug, an unusual screen size or a manufacturer specific Android build can push a single model over that line while your average stays healthy. Google warns users on those particular devices that the app may not work properly for them, rather than warning everybody. The company's own guidance is to aim for no worse than 2% on any individual phone model instead of treating 8% as the target.
How long does it take for an Android vitals warning to disappear?
Google checks your app's performance indicators daily using a 28 day average, and the warnings go away once that average improves. Store listing warnings can be removed faster than that when Play's systems detect the improvement early. The slower part is usually your own rollout, because the 28 day average only improves as fast as people install the fixed version. An app with sluggish update adoption can sit under a warning for weeks after the fix is technically finished and shipped.
Does Android vitals count crashes that happen in the background?
The two metrics that carry a penalty deliberately don't count them. Both are prefixed user-perceived, which means they only include crashes and freezes that happened while somebody was actually using the app and would have noticed. The plain crash rate and ANR rate metrics sitting next to them in the Play Console do include background events, which is why those numbers are usually higher and why teams sometimes panic at the wrong figure. Look at the user-perceived versions when you're checking your standing against a threshold.
Can I see Android vitals data without access to the Play Console?
No, and that catches out a lot of people who take over an app without taking over the account. Android vitals lives entirely inside the Play Console for the account that publishes the app, and there's no public view of it. If you've inherited an app whose previous developer still holds the account, getting your own access is the first job, ahead of any code work. Until then you're guessing at numbers that Google has already measured and is already acting on.
What happens if I decide not to fix a device specific problem?
Google's stated position is that you should weigh the cost of the ongoing poor experience first, since bad behavior hurts your current users and makes new ones harder to win. When fixing a particular device genuinely isn't practical, the documented alternative is to reconsider your device targeting and exclusion rules so the app stops being offered on hardware it can't run properly. That's a real option rather than an admission of defeat, and it's usually better than leaving a warning on your listing indefinitely. You lose those installs either way, and excluding the device at least protects your overall numbers.
Have a product decision to make?
RapidLabs helps founders and operators shape, build, and launch focused software.
Email the studio